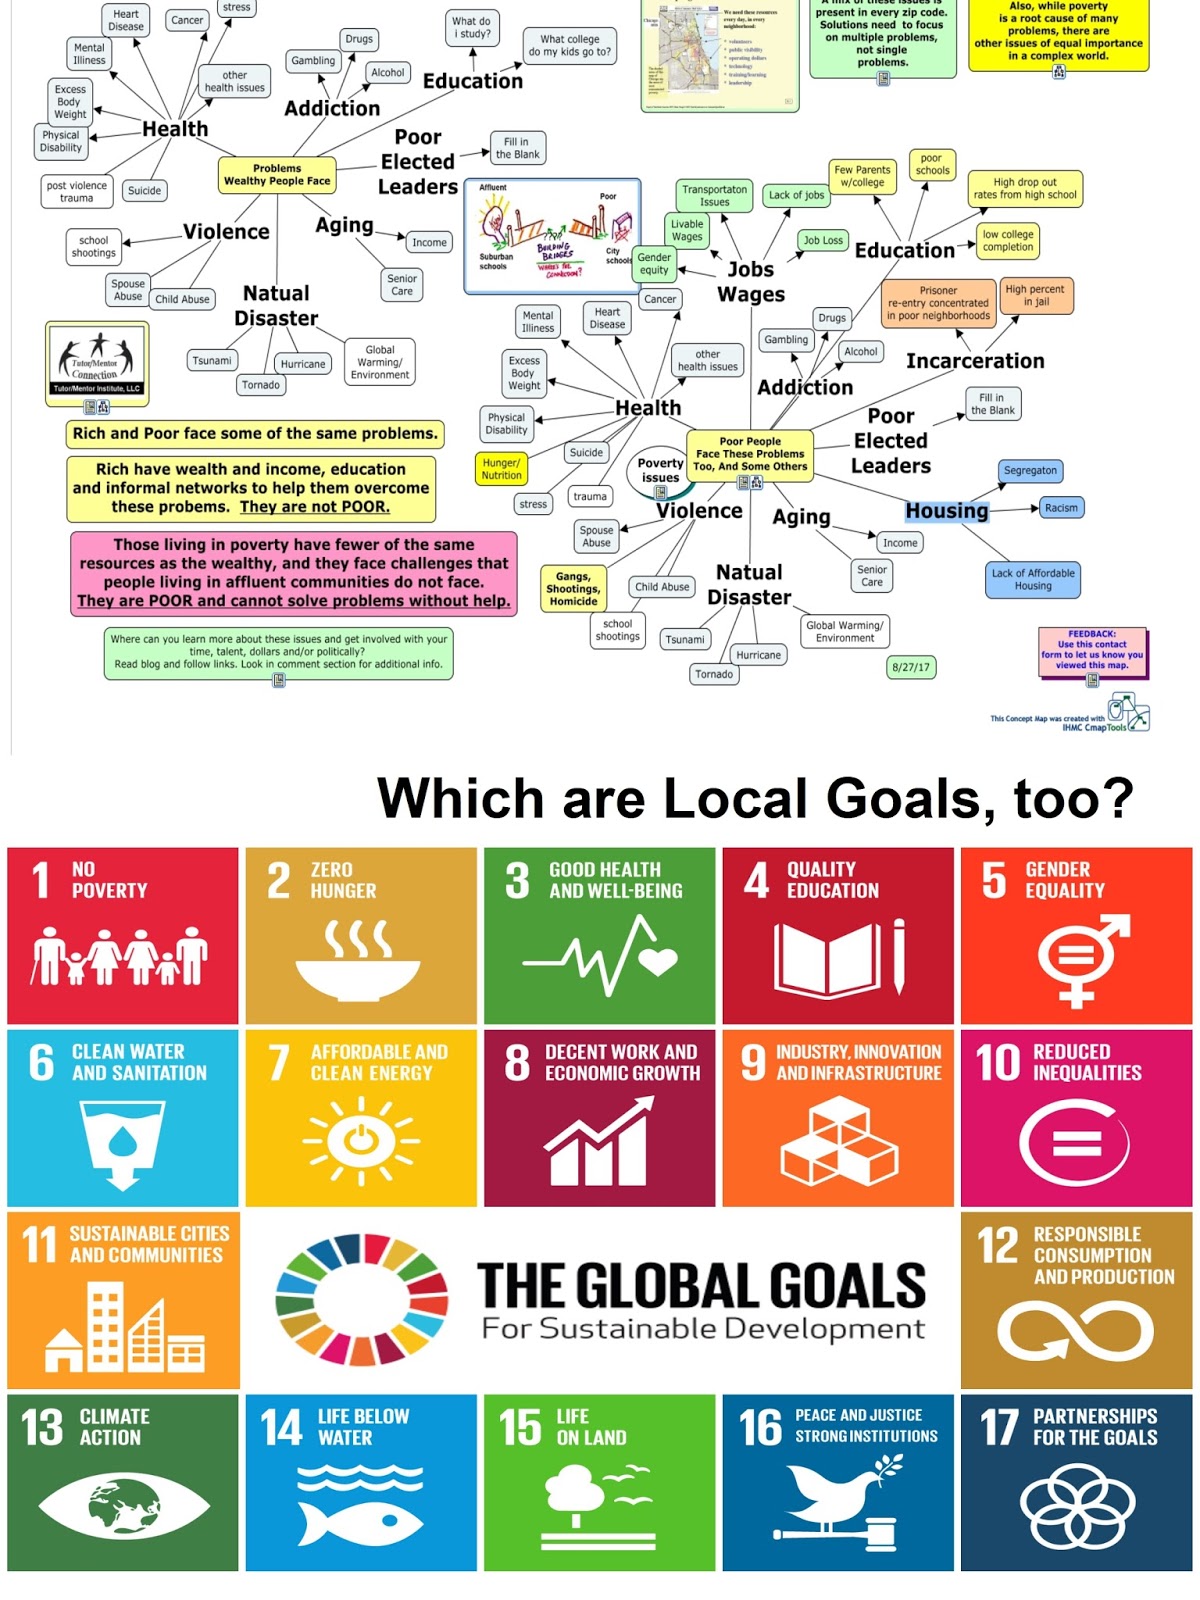
Below is an article from 2017. I had created this blog post, pointing to a 2017 report, by the Institute for Research on Race and Public Policy at UIC that focuses on the State of Racial Justice in Chicago . Then in a follow-up article, I used the same image, and embedded links, using Thinglink.
I learned about this from my #clmooc educator network.

Click on any of the nodes and you'll find an article related to that part of the graphic. Read the article and more like it. Share with people in your own network so more people will get involved and we can increase public will and the number who care.
Below are two more graphics I shared using ThingLink.
Service Learning Loop: In the early 2000s I created a pdf that shows how volunteers who get involved in a tutor/mentor program often become evangelists who draw other volunteers and donors to support the program. In 2007 an intern created an animation to illustrate what I call a "service learning loop". Below is a screen shot of his animation, using a Thinglink to point out different parts of the loop. Click on the dots and read the information provided.

All five parts of this loop are important. The weakest links are 1) support for knowledge aggregators who collect and share information others can use to get involved, and 2) not enough intermediaries who use their time, talent and communications ability to draw attention to the knowledge (right side) on a regular basis, so that more people use it to find where and how they can help (left side).
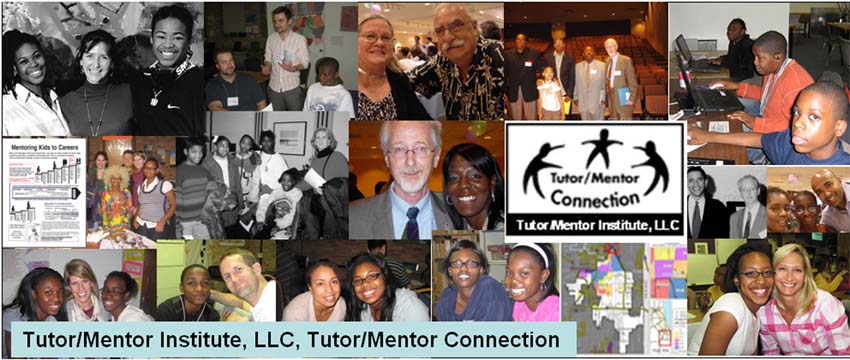
Below is another graphic showing my role as an intermediary, connecting people who can help (the list on the left) with information (the blue box) and people and organizations in places where help is needed (the tutor/mentor organizations I point to from the web library I host. .

I've used versions of this graphic in numerous articles and presentations. It's critical that more people understand the on-going role of intermediaries as well as the role of information libraries. See more graphics showing role of intermediaries at https://www.pinterest.com/tutormentor/role-of-intermediaries/
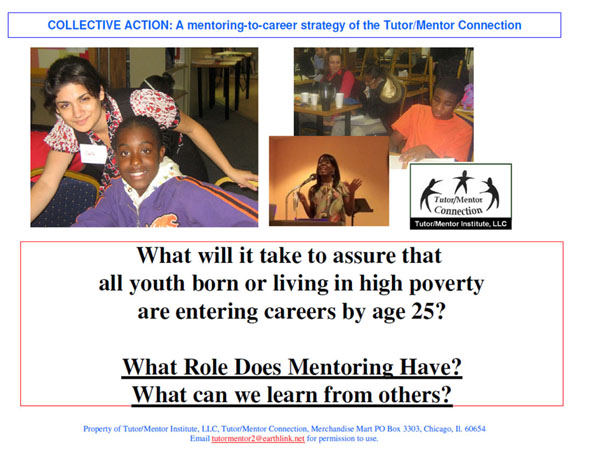
 I've used this and similar graphics to emphasize the many years it takes for kids to grow up. There are no quick fixes.
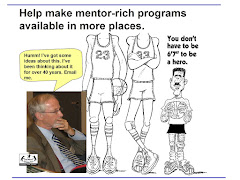
While many are needed in this intermediary role, investors need to also fund the work done by groups who collect and organize information. This needs to be done on a regular basis, and for many years. I wrote an article a while back showing some of the challenges involved.
I hope those who read this article will see themselves in this intermediary role and will share the article with others using social media and personal communications channels. That's putting this lesson into action. In fact, I encourage you to rewrite it, with your own interpretation, pointing to your city, and youth serving organizations operating in your city.
Service Learning Loop: In the early 2000s I created a pdf that shows how volunteers who get involved in a tutor/mentor program often become evangelists who draw other volunteers and donors to support the program. In 2007 an intern created an animation to illustrate what I call a "service learning loop". Below is a screen shot of his animation, using a Thinglink to point out different parts of the loop. Click on the dots and read the information provided.
All five parts of this loop are important. The weakest links are 1) support for knowledge aggregators who collect and share information others can use to get involved, and 2) not enough intermediaries who use their time, talent and communications ability to draw attention to the knowledge (right side) on a regular basis, so that more people use it to find where and how they can help (left side).
Below is another graphic showing my role as an intermediary, connecting people who can help (the list on the left) with information (the blue box) and people and organizations in places where help is needed (the tutor/mentor organizations I point to from the web library I host. .
I've used versions of this graphic in numerous articles and presentations. It's critical that more people understand the on-going role of intermediaries as well as the role of information libraries. See more graphics showing role of intermediaries at https://www.pinterest.com/tutormentor/role-of-intermediaries/

While many are needed in this intermediary role, investors need to also fund the work done by groups who collect and organize information. This needs to be done on a regular basis, and for many years. I wrote an article a while back showing some of the challenges involved.
I hope those who read this article will see themselves in this intermediary role and will share the article with others using social media and personal communications channels. That's putting this lesson into action. In fact, I encourage you to rewrite it, with your own interpretation, pointing to your city, and youth serving organizations operating in your city.
If you value these articles please consider a small contribution to help fund the Tutor/Mentor Institute, LLC. Click here to find a PayPal link you can use.